
2019: E-learning in figures
Here you can find numbers and statistics for 2019 usage of the systems that are maintained by the E-learning object. The statistics are retrieved mid-December 2019 so some numbers may have increased after that but the general situation is not affected. E-learning is continuously using data driven development and the figures presented here are only a selection of the data that decisions are based upon.
Note that the numbers are published twice (as a table and diagram), this to increase the accessibility of the information.
Number of course rooms in Canvas per school (diagram)
Course rooms in Canvas are created automatically for every course run and it is the teacher of the course that actively has to choose to publish the course room and make it available for the students. Some course runs are studying together and using the same course room. In that case the students are moved into one of the course room and the other remains unpublished and the publishing rate is affected but to a very low extent.
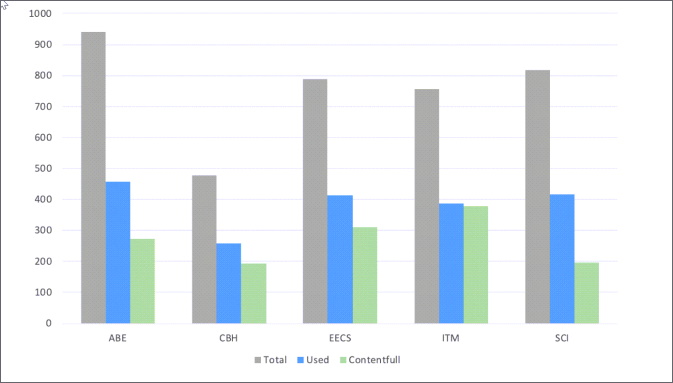
| School | Total | Used | Contentfull |
|---|---|---|---|
| ABE | 942 | 456 | 292 |
| CBH | 478 | 258 | 194 |
| EECS | 790 | 412 | 311 |
| ITM | 757 | 388 | 379 |
| SCI | 817 | 416 | 195 |
Number of PhD-level and thesis courses ares 650 and that type of courses does not use Canvas to such an extent. "Contentfull" indicates courses where number (assignments + modules + quizzes)> 3.
Number of course surveys
Students must be given the possibility to give their feedback and suggestions on the course design and implementation. Course surveys using LEQ are created on the initiative from the teachers in the course but they can also perform a survey using pen and paper or other tools for collecting the feedback from the students. The number of course surveys using LEQ is lower than the total number of courses indicating that there are a large number of courses using other ways than LEQ of collecting and evaluating courses. The LEQ survey is however most likely the most commonly used way.
Course surveys using LEQ per school (diagram)
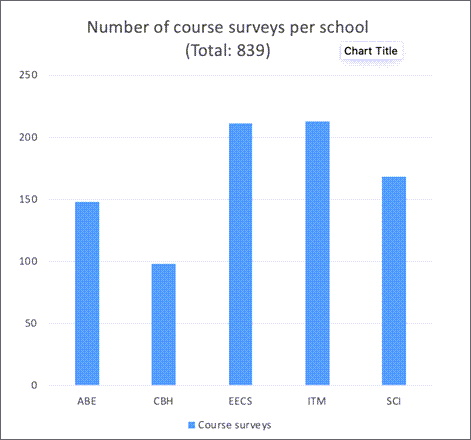
| School | Number |
|---|---|
| ABE | 148 |
| CBH | 98 |
| EECS | 211 |
| ITM | 213 |
| SCI | 168 |
Course surveys using LEQ, response rate per school, mean value: 28 % (diagram)
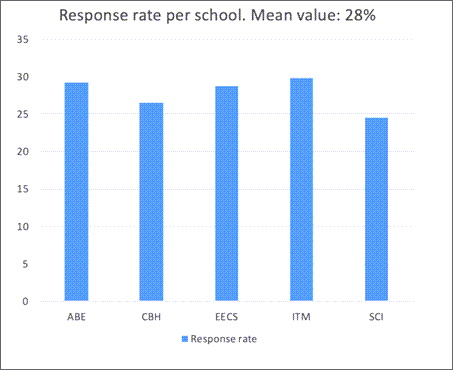
| School | Response rate % |
|---|---|
| ABE | 29.2 |
| CHB | 26.5 |
| EECS | 28.7 |
| ITM | 29.8 |
| SCI | 24.5 |
The response rate average is 28% for all surveys and the difference between schools are relatively small. The response rate is considered above average for the situation.
External applications in Canvas
KTH are providing a number of external applications as a complement and extension to Canvas and they are distributed among the schools as seen in the figure and table. Möbius and Wiris support mostly the same need and during 2019 some of the connections to Wiris were replaced by connections to Möbius. ITM and EECS are the schools that have the most courses using Kaltura application in Canvas for accessing video material.
External applications in Canvas, number of courses using a specific application per school (diagram)
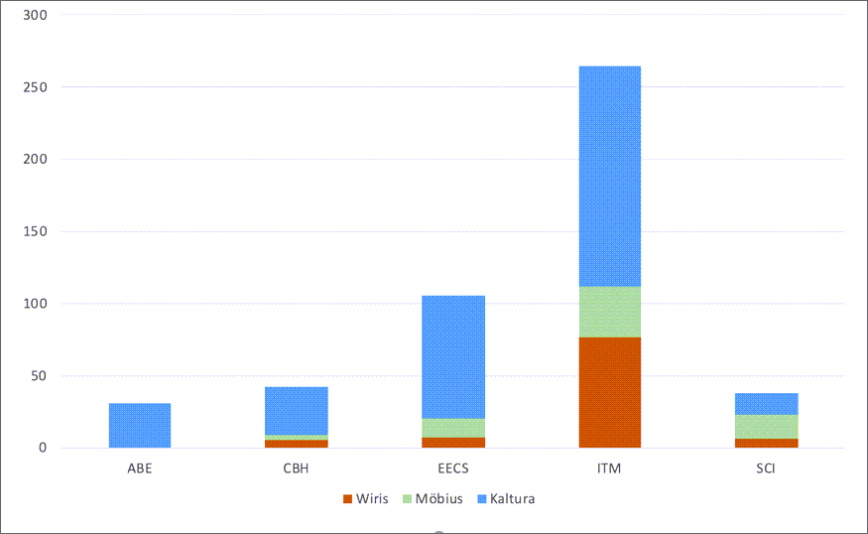
| School | Wiris | Möbius | Kaltura |
|---|---|---|---|
| ABE | 0 | 0 | 31 |
| CHB | 5 | 4 | 33 |
| EECS | 7 | 13 | 86 |
| ITM | 77 | 35 | 153 |
| SCI | 6 | 17 | 15 |
Plagiarism checking with URKUND
Total documents reviewed: 57832.
Number of users viewed document: 593.
URKUND can be used as a standalone web service as well as an integrated service in Canvas where the assignments are connected to URKUND. The figures here apply to both ways but where the documents checked via Canvas make up the majority and is also an increasing number.