
Statistical trends for E-learning in figures
Here you can find trends in the yearly numbers and statistics for the usage of the systems that are maintained by the E-learning object. E-learning is continuously using data driven development and the figures presented here are only a selection of the data that decisions are based upon.
The usage of course rooms
Course rooms in Canvas are created automatically for every course run, but they are unpublished when created. It is the teacher of the course that actively has to choose to publish the course room and make it available for the students. A course rooms is considered "contentfull" when the sum of the number of assignments, modules and quizzes are more than three.
The number of published course rooms is generally stable or increasing for the different schools, with the exception of the period 2024 – 2025 when all schools show a clear decrease. The decrease may be linked to the fact that the public education grant to KTH was reduced during this period.
The proportion of published course rooms that are filled with materials varies over the years, although all levels are high.
It is important to mention that the statistics for 2022 and 2023 have been updated retrospectively (in 2025) when a new and more reliable method was introduced to collect and manage data. This method was used for 2022 and onwards.
Diagram: published and contentfull course rooms

Tables: published and contentfull course rooms
| 2019 | 2020 | 2021 | 2022 | 2023 | 2024 | 2025 | |
|---|---|---|---|---|---|---|---|
| ABE | 456 | 349 | 371 | 351 | 451 | 463 | 411 |
| CBH | 258 | 283 | 297 | 272 | 309 | 329 | 265 |
| EECS | 412 | 376 | 409 | 311 | 451 | 438 | 381 |
| ITM | 388 | 466 | 471 | 493 | 584 | 613 | 478 |
| SCI | 416 | 327 | 326 | 230 | 341 | 356 | 300 |
| 2019 | 2020 | 2021 | 2022 | 2023 | 2024 | 2025 | |
|---|---|---|---|---|---|---|---|
| ABE | 64 | 79 | 82 | 84 | 88 | 61 | 83 |
| CBH | 75 | 81 | 82 | 88 | 94 | 63 | 95 |
| EECS | 75 | 90 | 90 | 93 | 92 | 67 | 93 |
| ITM | 98 | 88 | 92 | 90 | 93 | 66 | 91 |
| SCI | 47 | 67 | 73 | 79 | 87 | 63 | 87 |
Course surveys (LEQ)
Students must be given the possibility to give their feedback and suggestions on the course design and implementation. Course surveys using LEQ are created on the initiative from the teachers in the course but they can also perform a survey using pen and paper or other tools for collecting the feedback from the students.
The schools show some differences in the number of LEQ-surves sent out, but the response rate is similar and is therefore shown as an average. In the data we can see an increase in the number of course surveys since 2019 and also a steady decline in the response rate during the same time period, seeming to level out at slightly above 15%. The biggest change for both data sets happened 2020, which indicates that the pandemic might have influenced the data.
In 2025, an automatic system for creating course surveys was introduced in the LEQ system, which greatly increased the number of surveys and also the response rate.
Diagram: the number of LEQ and the response rate

Table: the number of surveys and the response rate
| 2019 | 2020 | 2021 | 2022 | 2023 | 2024 | 2025 | |
|---|---|---|---|---|---|---|---|
| Total number of surveys | 839 | 1094 | 1130 | 1142 | 1033 | 1007 | 2239 |
| The average response rate (%) | 28 | 20 | 19.4 | 16.4 | 15.7 | 15.6 | 23.5 |
The usage of inbuilt tools for plagiarism check
Up until October 2025 KTH used Ouriginality for plagiarism check, but afterwards Inspera Originality was used. The switch to the new tool was done manually, which wasn't always done correctly. This is probably the biggest reason why November and December 2025 are about 50% lower than 2024, even though January to August are higher. It also explains the low number of active users in Inspera Originality.
Ouriginal can be used as a standalone web service as well as an integrated service in Canvas where the assignments are connected to Ouriginal. The figures here apply to both ways but where the documents checked via Canvas make up the majority and is also an increasing number.
The number of users in Ouriginal varies for each year without any noticable trend, but the total in 2023 is still higher than in 2019. However, the number of documents sent to Ouriginal show a clear declining trend until 2023 since the sharp increase at 2020, but the trend seems to have turned at 2024. The totals for users and documents 2025 are not complete. The graph and table also have the projected number of documents which would have been submitted if the trend for the year continued.
Diagram: the number of users and documents
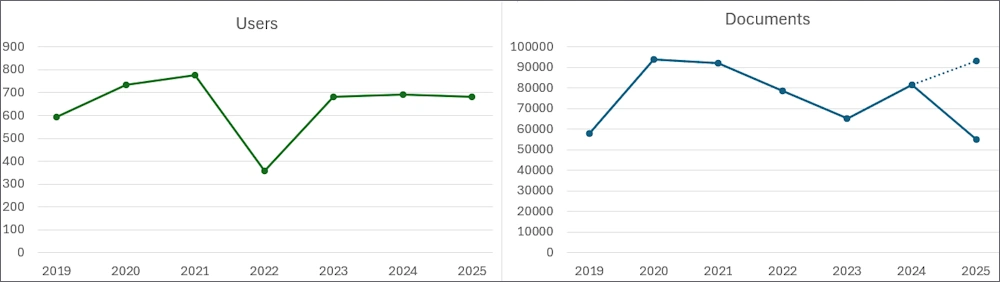
Table: the number of users and documents
| 2019 | 2020 | 2021 | 2022 | 2023 | 2024 | 2025 | |
|---|---|---|---|---|---|---|---|
| Number of documents | 57832 | 94000 | 92000 | 78698 | 65141 | 81407 | 54981 (projected: 93000) |
| Number of users | 593 | 734 | 776 | 358 | 680 | 691 | 681 |
Solved tickets in Edge
Questions via email are handled as tickets in Edge, the ticket management system. The support part of E-learning primarily handles tickets and distributes more specialized tickets to the pedagogical and IT-focused teams. Here we present the number of solved tickets per year for the different teams, called "Pedagogical", "Support" and "IT".
Graph: Solved tickets per year and team

Table: Solved tickets per year and team
| 2022 | 2023 | 2024 | 2025 | |
|---|---|---|---|---|
| Pedagogical | 566 | 734 | 509 | 633 |
| Support | 2894 | 2597 | 2928 | 3040 |
| IT | 283 | 353 | 244 | 258 |