2025: E-learning in figures
Here you can find numbers and statistics for 2025 usage of the systems that are maintained by the e-learning object. E-learning is continuously using data driven development and the figures presented here are only a selection of the data that decisions are based upon.
Course rooms in Canvas
Course rooms in Canvas are created automatically for every course run and it is the teacher of the course that actively has to choose to publish the course room and make it available for the students.
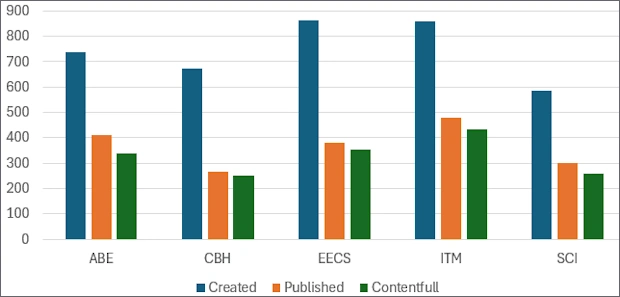
The statistics are divided into the number of course rooms that are created, published and contentfull. "Contentfull" indicates courses where the sum of the number of assignments, modules and quizzes are more than 3.
| School | Created | Published | Contentfull |
|---|---|---|---|
| ABE | 736 | 411 | 340 |
| CBH | 674 | 265 | 251 |
| EECS | 863 | 381 | 353 |
| ITM | 858 | 478 | 434 |
| SCI | 584 | 300 | 260 |
Diagram: course rooms in Canvas per school
Course surveys
Students must be given the possibility to give their feedback and suggestions on the course design and implementation. Starting in 2025, course surveys are created automatically in the same system for all courses at KTH.
Total number of course surveys: 2239.
There is a noticable increase in course surveys compared to previous years, as all of them are created automatically and in the same system. The response rate has also increased significantly.
| School | Number of surveys | Number of survey invitations sent out | Response rate % |
|---|---|---|---|
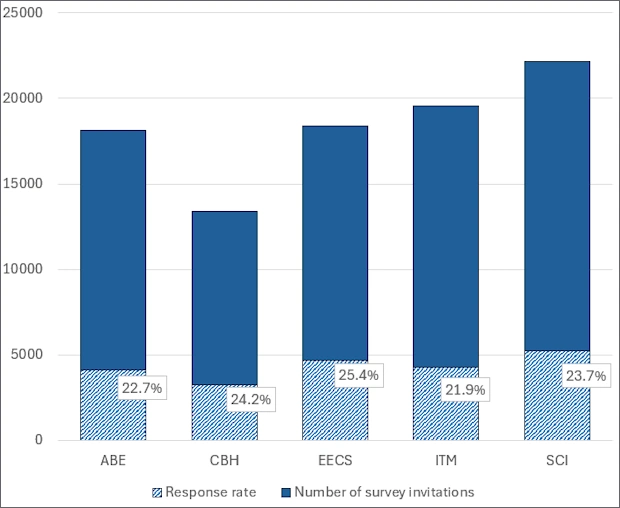
| ABE | 426 | 18139 | 22.7 |
| CBH | 416 | 13406 | 24.2 |
| EECS | 486 | 18370 | 25.4 |
| ITM | 514 | 19570 | 21.9 |
| SCI | 298 | 22152 | 23.7 |
Diagram: course surveys per school
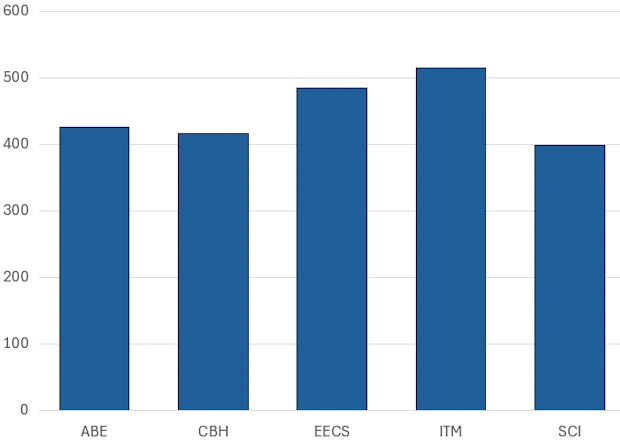
Diagram: response rate per school
External applications (LTI-apps) in Canvas
KTH provides a number of external applications, known as LTI-apps, as a complement and extension to Canvas. KTH also provides support on a few LTI apps: Kaltura (KTH Play), Möbius, KTH Import exams and KTH Transfer to Ladok.
There are licenses for Möbius, but they must be requested. The remaining applications have been activated when teachers requested them.
Kaltura is not included in the statistics as the data is not available.
The data for KTH Import Exams and KTH Transfer to Ladok are presented in a separate table since they dominate the LTI apps and are better analyzed separately.
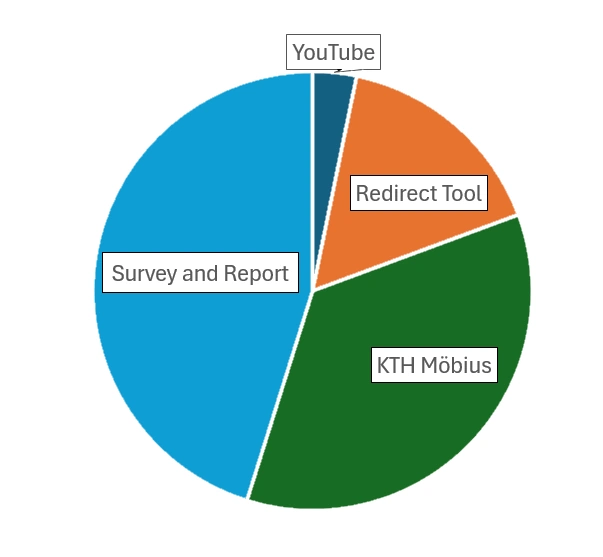
| Application | ABE | CBH | EECS | ITM | SCI |
|---|---|---|---|---|---|
| Box | 0 | 0 | 0 | 3 | 0 |
| Canvas Studio | 0 | 0 | 3 | 20 | 0 |
| Feedback Fruits | 1 | 0 | 18 | 9 | 0 |
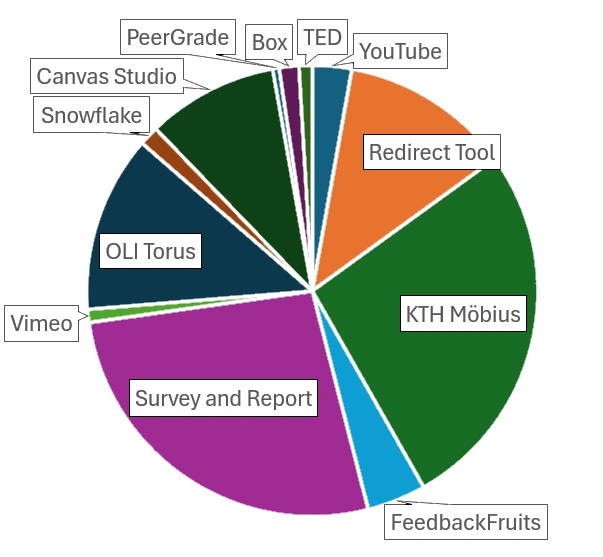
| Möbius | 1 | 3 | 16 | 57 | 11 |
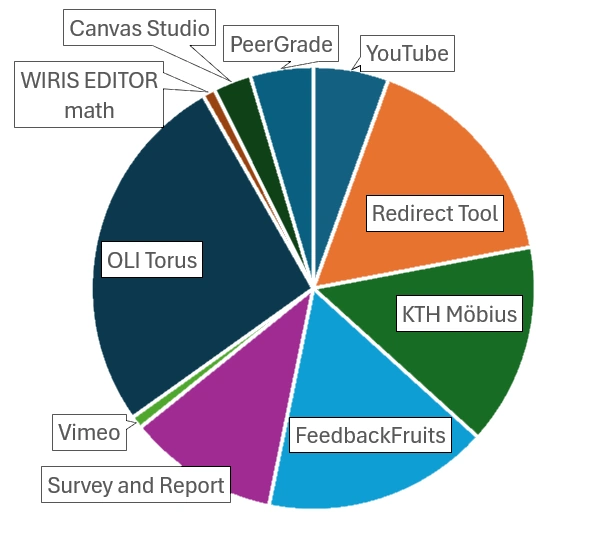
| OLI Torus | 0 | 1 | 29 | 27 | 0 |
| Peergrade | 0 | 0 | 5 | 1 | 0 |
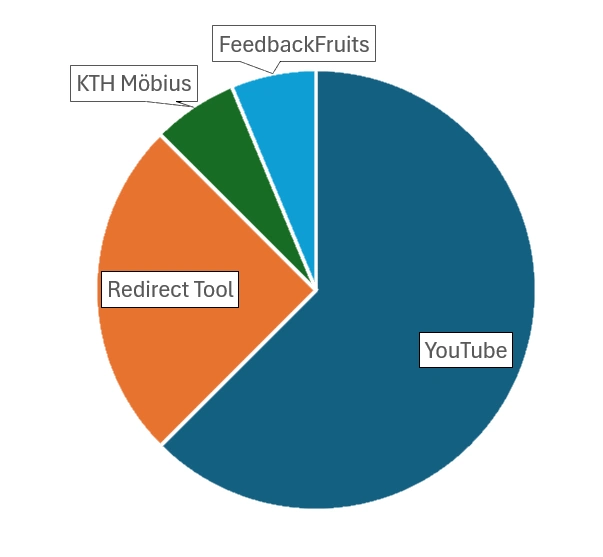
| Redirect | 4 | 4 | 18 | 26 | 5 |
| Snowflake | 0 | 2 | 0 | 3 | 0 |
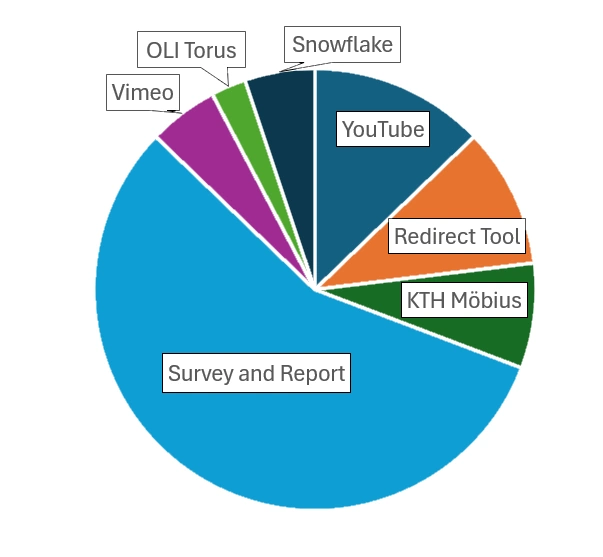
| Survey and Report | 16 | 22 | 12 | 57 | 14 |
| Ted Ed embed | 0 | 0 | 0 | 2 | 0 |
| Vimeo embed | 1 | 2 | 1 | 2 | 0 |
| WIRIS EDITOR math | 0 | 0 | 1 | 0 | 0 |
| Youtube embed | 10 | 5 | 6 | 6 | 1 |
Diagram: courses per school with specific external application activated
These diagrams exclude "KTH Import exams" and "KTH Transfer to Ladok".
| School | KTH Import Exams | KTH Transfer to Ladok |
|---|---|---|
| ABE | 153 | 94 |
| CBH | 179 | 46 |
| EECS | 174 | 142 |
| ITM | 171 | 65 |
| SCI | 284 | 137 |
Quizzes with Mentimeter
The Mentimeter tool is mainly used to create surveys or quizzes that can be answered online, but can also be used for presentations. The tool is an alternative to so-called clicker questions for distance and hybrid occasions, often used to see if students have understood the content.
Active members: 1433.
Number of held quizzes and presentations: 2338.
Number of participants: 52464.
There is a noticable increase in all categories compared to last year.
Plagiarism check
KTH switched its plagiarism control tool from Ouriginal to Inspera Originality in October 2025. We lost access to the previous tool, which resulted in approximately two months of statistics not being saved. The statistics are therefore presented below as per month rather than just total.
| Jan | Feb | Mar | Apr | Maj | Jun | Jul | Aug | Sep | Oct | Nov | Dec |
|---|---|---|---|---|---|---|---|---|---|---|---|
| 7643 | 7284 | 7451 | 4776 | 8043 | 4397 | 583 | 1119 | 1850 (9 days) | 21 | 7159 | 4655 |
Total documents reviewed: 54981 .
Active users in Ouriginal was 681, while Inspera Originality had 268 active users.
The switch to the new tool is done manually, meaning that if an assignment in Canvas was created with the older tool, teachers need to switch the tool to Inspera Originality themselves. This is probably the biggest reason why November and December are about 50% lower than last year, even though January to August are higher. It also explains the low number of active users in Inspera Originality.
Solved tickets in Edge
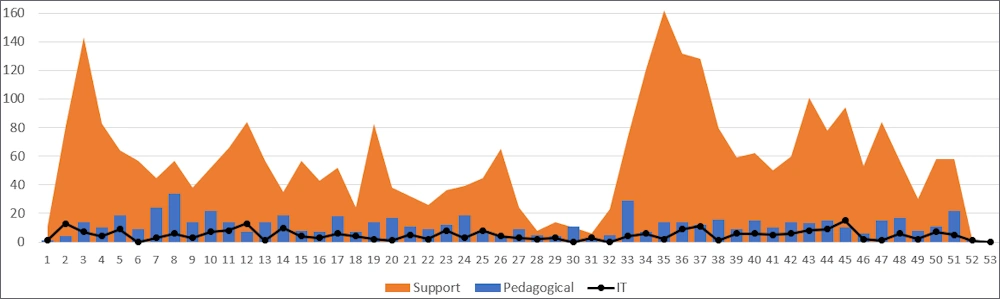
Questions via email are handled as tickets in Edge, the ticket management system. The support part of E-learning primarily handles tickets and distributes more specialized tickets to the pedagogical and IT-focused teams. Here we present the number of solved tickets per week for the different teams, called "Pedagogical", "Support" and "IT".
Total solved tickets for 2025:
- Pedagogical: 633.
- Support: 3040.
- IT: 258.
Diagram: solved tickets per week