
How guessing affects the passing grade
The risk with quiz questions with given answer options is that the students can guess the correct answer to the questions. In order to measure students' actual level of knowledge, you need to take guessing into account when deciding the passing grade. Here we use a scientific article by Brett P. Foley to calculate this risk and give suggestions on how to manage it.
The probability of getting a passing grade by guessing
Let's say you have a 20-question quiz with "multiple choice" questions with one correct answer option. The probability that students guess correctly on a question depends on the number of answer options, but what is the probability that they will guess correctly on several questions?
To answer this question, we start with Foley, Brett P. (2019) "Getting Lucky: How Guessing Threatens the Validity of Performance Classifications". Especially the calculations in Appendix A, about the probability of a student achieving a certain number of correct answers on a quiz by just guessing. The probabilities of questions with two, three, four, and five answer options are listed in Table 1 and are also shown in Figure 1.
Note! We have assumed that all answer options are equally likely. That is, the incorrect answer options are plausible and worded similarly to the correct answer option. Read more about Formulate questions and answer options .
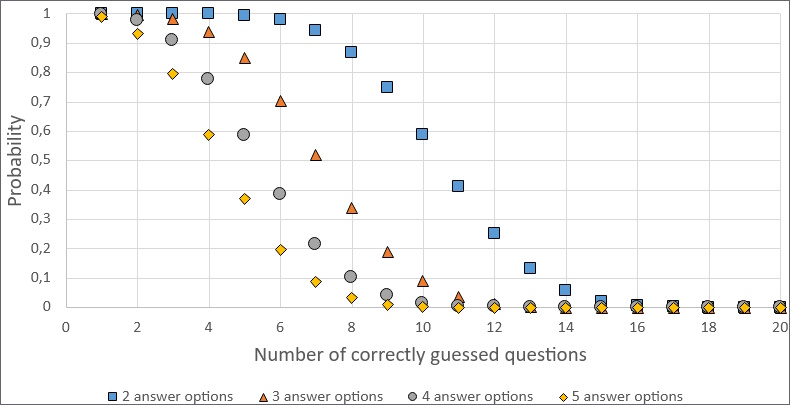
A student is almost guaranteed to guess one or two questions correctly regardless of the number of answer options. However, the probability decreases faster the more answer options per question. For four and five answer options, there is a very low probability that someone guesses correctly on more than 8 or 9 questions. For three answer options, it's closer to 11 and with only two answer options, it's around 15 questions.
| Number of correctly guessed question | 2 answer options (%) | 3 answer options (%) | 4 answer options (%) | 5 answer options (%) |
|---|---|---|---|---|
| 1 |
100 |
99.97 |
99.68 |
98.85 |
| 2 |
100 |
99.67 |
97.57 |
93.08 |
| 3 |
99.98 |
98.24 |
90.87 |
79.39 |
| 4 |
99.87 |
93.96 |
77.48 |
58.86 |
| 5 |
99.41 |
84.85 |
58.52 |
37.04 |
| 6 |
97.93 |
70.28 |
38.28 |
19.58 |
| 7 |
94.23 |
52.07 |
21.42 |
8.67 |
|
8 |
86.84 |
33.85 |
10.18 |
3.21* |
| 9 |
74.83 |
19.05 |
4.09* |
1.00 |
| 10 |
58.81 |
9.19 |
1.39 |
0.26 |
| 11 |
41.19 |
3.76* |
0.39 |
0.06 |
| 12 |
25.17 |
1.30 |
0.09 |
0.01 |
| 13 |
13.16 |
0.37 |
0.02 |
0 |
| 14 |
5.77 |
0.09 |
0 | 0 |
| 15 |
2.07* |
0.02 |
0 | 0 |
| 16 |
0.59 |
0 | 0 | 0 |
| 17 |
0.13 |
0 | 0 | 0 |
| 18 |
0.02 |
0 | 0 | 0 |
| 19 | 0 | 0 | 0 | 0 |
| 20 | 0 | 0 | 0 | 0 |
Things to keep in mind when setting grade ranges
The risk is never zero for a student to guess all the correct ones on a quiz, but it becomes vanishingly small for longer quizzes. Brett P Foley uses 5% probability as the minimum threshold, but also suggests the limits of 10% or 1% depending on the importance of the quiz. However, the minimum threshold is only a minimum value to stay above, it is not the recommended passing grade. Information on how to adjust the grade ranges can be found at the end of the page.
In the previous example, we used a quiz with 20 questions, but a quiz with few questions makes the grading scale very narrow. For example, if you use three answer options, each grade on a scale of A to E would correspond to two questions each. Students don't get any room to make mistakes, and you need to create a quiz that reflects such a narrow scale. Therefore, we recommend that you extend quizzes with few answer options or that you use a simpler grading scale, such as Pass/Fail.
As an example of a long quiz, we have created lists of the minimum threshold of 1%, 5%, and 10% for a 100-question quiz.
Possible problems with the model
We have used certain assumptions in our calculations that are explained in detail in the article by Brett P. Foley. However, problems with the model can arise when these assumptions are not met. Brett P Foley, for example, finds these problems:
- Students can skip questions instead of guessing. If you have raised the grade ranges to discourage guessing and no guessing is happening, that student will have a harder time reaching a passing grade.
- Students may have partial knowledge that allows them to rule out answer options and then guess. For example, a student may not know which answer option is correct but know that one of them is guaranteed to be incorrect. Then it is more likely that the student guesses correctly than the model says.
Methods for adjusting the passing grade
There are many articles about the different ways to adjust the passing grade on quizzes. Brett P Foley discusses the following formula in Appendix D to calculate the adjusted passing grade (Xadj):
\(X_{adj} = X_{raw} + [P*L*(X_{max} - X_{raw})]\)
Xraw is the unadjusted score for the passing grade.
Xmax is the highest score you can get on the quiz.
P is the probability of guessing correctly per question (based on the number of answer options).
L is the probability of a student guessing a question when they don't know the answer. Brett P. Foley explains how this can be estimated in Appendix D based on calculations in Appendix C.
The following articles are some other examples of ways to handle assessment of quizzes when students can guess the correct answer. This is only a selection, those interested are advised to look up more articles.
- Formula Scoring of Multiple-Choice Tests (Correction for Guessing) (onlinelibrary.wiley.com) .
- Optimal Correction for Guessing in Multiple-Choice Tests (researchgate.net) .